1. Model Domain
The domain of the model covers the British Isles with a grid resolution of 5 km and grid dimensions of 172 x 244. Input gas and aerosol concentrations at the edge of the model domain are calculated using FRAME-EUROPE, a larger scale European simulation which was developed from TERN to run a statistical model over the entirety of Europe with a 150 km scale resolution. FRAME is a Lagrangian model that simulates an air column moving along straight-line trajectories. The atmosphere is divided into 33 separate layers extending from the ground to an altitude of 2500 m. Layer thicknesses vary from 1 m at the surface to 100 m at the top of domain. Separate trajectories are run at a 1o resolution for all grid edge points. A year-specific wind rose is used to give the appropriate weighting to directional deposition and concentration for calculation of total deposition and average concentration.
2. Emissions
Emissions of ammonia are estimated for each 5 km grid square using national data of farm animal numbers (cattle, poultry, pigs and sheep) as well as fertiliser application, crops and non-agricultural emissions (including traffic and contributions from human sources, wild animals etc). The ammonia emissions inventory is described in Dragosits et al. (1998). NH3 is emitted into the lowest layer. Emissions of SO2 and NOX are from the National Atmospheric Emissions Inventory for the United Kingdom (Salway et al., 1999). For SO2 approximately 80% of 1996 emissions from the UK are associated with a small number of strong point source emissions. For NOX, point source emissions account for approximately 25% of the total.
3. Plume Rise
Point source emissions of SO2 and NOX are treated individually with a plume rise model which uses stack height, temperature and exit velocity to calculate an ‘effective emissions height’ (Vieno, 2003). The plume reaches its maximum height when its temperature is equal to that of the surrounding environment and its momentum is dissipated. Buoyancy forces dominate the plume rise, which is parameterised separately for stable conditions and for neutral and unstable conditions according to the Pasquill-Gifford stability classes.
4. Diffusion
Diffusion of gaseous and particulate species in the vertical is calculated using K-theory eddy diffusivity and solved with a Finite Volume Method. The vertical diffusivity KZ has a linearly increasing value up to a specified height HZ and then remains constant (Kmax) to the top of the boundary layer. During day time, when diffusivity depends on a combination of mechanical and convective mixing, HZ is taken as 200 m and Kmax is a function of the boundary layer depth and the geostrophic wind speed. At night-time these values depend on the Pasquill stability class.
5. Chemistry
The chemical scheme in FRAME is similar to that employed in the EMEP Lagrangian model (Barrett and Seland, 1995). The prognostic chemical variables calculated in FRAME are: NH3, NO, NO2, HNO3, PAN, SO2, H2SO4, as well as NH4+, NO3- and SO4—aerosol. For oxidised nitrogen, a suite of gas phase reactions are considered. These include photolytic dissociation of NO2, oxidation of NO by ozone, formation of PAN (peroxyacetyl nitrate) and the creation of nitric acid by reaction with the OH. free radical. NH4NO3 aerosol is formed by the equilibrium reaction between HNO3 and NH3. A second category of large nitrate aerosol is present and simulates the deposition of nitric acid on to soil dust or marine aerosol. The formation of H2SO4 by gas phase oxidation of SO2 is represented by a predefined oxidation rate. H2SO4 then reacts with NH3 to form ammonium sulphate aerosol. The aqueous phase reactions considered in the model include the oxidation of S(IV) by O3, H2O2 and the metal catalysed reaction with O2.
6. Wet Deposition
The model employs a constant drizzle approach using precipitation rates calculated from a climatological map of average annual precipitation for the British Isles. Wet deposition of chemical species are calculated using scavenging coefficients based on those used in the EMEP model. An enhanced washout rate is assumed over hill areas due to the scavenging of cloud droplets by the seeder-feeder effect. The washout rate for the orographic component of rainfall is assumed to be twice that calculated for the non-orographic component (Dore et al., 1992). The model incorporates the directional dependence of orographic rainfall by considering two components of rainfall: non-orographic precipitation which has no directional dependence and orographic precipitation which is directionally dependent and stronger for wind directions associated with humid air masses. The directional orographic rainfall model is described in detail in Fournier et. al, 2001 and 2003(a).
7. Dry Deposition
Dry deposition of SO2, NO2 and NH3 is calculated individually to five different land categories (arable, forest, moor-land, grassland and urban). For ammonia, deposition is calculated individually at each grid square using a canopy resistance model (Singles et al., 1998). The deposition velocity is generated from the sums of the aerodynamic resistance, the laminar boundary layer resistance and the surface resistance. Dry deposition of SO2 and NO2 is calculated using maps of deposition velocity derived by the CEH ‘big leaf’ model (Smith et al. 2000), which takes account of surface properties as well as the geographical and altitudinal variation of wind-speed. Other species are assigned constant values of deposition velocity.
8. Diurnal Cycle
The depth of the boundary layer in FRAME is calculated using a mixed boundary layer model with constant potential temperature capped by an inversion layer with a discontinuity in potential temperature. Solar irradiance is calculated as a function of latitude, time of the year and time of the day. At night-time, a single fixed value is used for the boundary layer depth according to Pasquill stability class and surface windspeed.
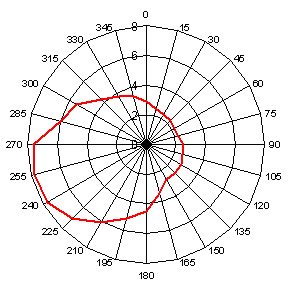
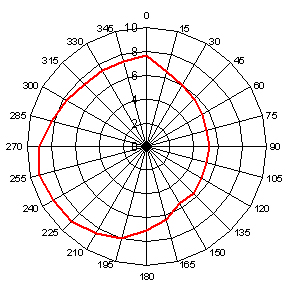
9. Wind Rose
The wind rose employed in FRAME uses 6-hourly operational radiosonde data from the stations of Stornoway, Hillsborough, Camborne and Valentia spanning a ten year period (1991-2000) to establish the frequency and harmonic mean wind speed as a function of direction for the British Isles. This is illustrated in figure 1(a) and figure 1(b) for data averaged over the ten year period.
 |
 |
|
Figure 1(a). Frequency of wind (%) as a function of wind direction calculated from radiosonde data for the period 1991-2000. |
Figure 1(b). Wind speed (m s-1) as a function of wind direction calculated from radiosonde data for the period 1991-2000. |
10. Computational
Performance
The model code is written in High Performance Fortran 90 and executed in parallel on a Linux Beowulf cluster comprising of 60 dual processors. Run time for a simulation employing 50 processors is approximately 15 minutes.
References
Dragosits, U., M.A. Sutton, C.J. Place & A. Bayley (1998) Modelling the spatial distribution of ammonia emissions in the United Kingdom. Environmental Pollution, 102(S1), 195-203.
Salway, A.G., H.S. Eggleston, J.W.L. Goodwin, J.E. Berry & T.P. Murrells (1999) UK Emissions of Air Pollutants 1970-1996. Report AEAT-3092. National Atmospheric Emissions Inventory, AEA Technology, National Environmental
Technology Centre.
Vieno, M. (2003) The importance of emission height in an atmospheric transport Model. 2nd year PhD report, University of Edinburgh.
Barret, K. and Seland, O. (1995) European transboundary acidifying air pollution – Ten years calculated field and budgets to the end of the first sulphur protocol. EMEP, 1/95, Norwegian Meteor. Inst. Oslo, Norway.
Dore, A.J., T.W.Choularton and D.Fowler (1992) An improved wet deposition map of the United Kingdom incorporating the topographic dependence of rainfall concentrations. Atmos.Env. 26A, 1375-1381.
Fournier, N., K.J Weston, M.A. Sutton and A.J. Dore (2001) Inclusion of an improved parameterisation of the wet deposition process in an atmospheric transport model. Proceedings of the 25th NATO/CCMS international technical meeting on air pollution modelling and its application, 265-273. Louvain-la-Neuve, Belgium, 15-19 October 2001.
Fournier, N., K.J.W.Weston, A.J.Dore and M.A.Sutton (2003a) Modelling the wet deposition of reduced nitrogen over the British Isles using a multi-layer atmospheric transport model Q.J.Roy.Met.Soc. (under review)
Singles, R., M.A. Sutton & K.J. Weston (1998) A multi-layer model to describe the atmospheric transport and deposition of ammonia in Great Britain. Atmos. Environ., 32, 393-399.
Smith R.I., Fowler D., Sutton M.A., Flechard C. and Coyle M. (2000) Regional estimation of pollutant gas deposition in the UK: model description, sensitivity analyses and outputs. Atmos. Environ. 34, 3757-3777.